Materials Innovations
Full Html
Vol 3 Issue 4
Unveiling Water Contamination: Detecting Nickel Toxicity with a Cutting-Edge Portable Neutron Generator
Pages: 41-51
Doi: 10.54738/MI.2023.3401
Doi URL: http://doi.org/10.54738/MI.2023.3401
1 Department of Material Chemistry, Graduate School of Engineering, Kyoto University, Nishikyo-ku, Kyoto , 615-8520, Japan
2 Physics Department, King Fahd University of Petroleum & Minerals, KFUPM, Dhahran , 31261, Saudi Arabia
This study focuses on the performance evaluation of a large cylindrical CeBr3 detector (76 mm × 76 mm) for detecting nickel concentration in contaminated water samples. Using prompt gamma neutron activation analysis, water samples contaminated with different concentrations of nickel (2.7, 5.0, and 6.5 wt.%) were investigated. By analyzing gamma rays emitted at 8993 and 9498 keV, originating from nickel, the net nickel counts were derived by comparing the sample spectrum with the background spectrum. These net counts exhibited a proportional relationship with the concentration of nickel in water. Additionally, it was assumed that the cohesive yield of the peak with nickel in the difference spectrum of each sample corresponds to its respective nickel concentration. By employing linear regression analysis, a robust correlation (R2 = 0.997) was established between the cohesive yield of the net peak related to nickel and the corresponding nickel concentration in the analyzed water samples. The minimum detectable concentration (MDC) was determined by calculating the two peaks entire counts. It was determined that this MDC was 0.0815±0.0250 wt.%, or 815±250 ppm. These results demonstrate the remarkable evaluation of the CeBr3 detector in accurately identifying the presence of nickel in water samples, as evidenced by its ability to detect even very low concentrations based on the total counts of the two peaks.
Keywords
Water toxicity, Nickel, Detection limit
Harmful water materials must be detected and appropriately managed to guarantee the health and safety of people and the environment. When hazardous substances like lead, arsenic, nickel, and mercury are consumed, it can have detrimental consequences on one's health, including damage to the brain, kidneys, and other organs. 1, 2 Additionally, these substances can disrupt aquatic life and ruin ecosystems. Additionally, using water for agriculture, industrial activities, and other reasons might be made difficult or impossible by the presence of harmful compounds in the water. Toxic substances in water must be found to preserve public health and the environment and ensure everyone can access clean, safe water. 3Prompt gamma neutron activation analysis (PGNAA) is a radio-analytical technique that enables the determination for the materials elemental compositions. 4 PGNAA is a non-destructive method specifically designed for detecting trace amounts of elements within a given sample. PGNAA finds applications across various scientific? disciplines, including physics, materials science, chemistry, geology, archaeology, and pharmaceuticals. The persistent improvements in gamma-ray detection technology, for instance energy resolution and increased detection efficiency, have broadened the applicability of PGNAA in a variety of sectors, including industrial operations, environmental studies, medical research, and homeland security. 5, 6 Measuring a sample's composition, specifically, the proportion of each element present, holds significant importance in many scenarios. For instance, conducting analyses of samples for potentially hazardous radioactive or poisonous pollutants in soil, food, water, or even construction materials necessitate correct composition determination. These contaminants can be found in any of these environments. PGNAA excels in such situations, offering a highly efficient technique capable of analyzing samples ranging from micrograms to kilograms. Moreover, its user-friendly nature makes it easily manageable for researchers and analysts alike.7
When a sample is exposed to neutron beams, the resulting interaction causes the emission of gamma rays by the elements present within the sample. The specific energies of these gamma rays correspond to the concentrations of the elements. 8, 9 A detector is used to collect these gamma rays that have been released, and the detector then transforms them into electrical pulses. The pulses are then displayed as peaks in a distinctive distribution pattern on a computer screen. PGNAA is a widely utilized technique to identify and address water contamination across industries including agriculture, pharmacy, petroleum, and others. This particular study focused on the application of the PGNAA technique to detect the presence of nickel in water samples. Nickel is predominantly utilized in producing stainless steel products and holds significant roles in other sectors, including catalysis, metalwork products, and rechargeable batteries.
Liquid forms of manufacturing waste are frequently encountered. Improper treatment of such waste can contaminate water, leading to various detrimental health effects. 2, 10, 11, 12 High concentrations of nickel in water pose particular health risks, including an increased likelihood of developing larynx cancer, lung embolism, prostate cancer, nose cancer, chronic bronchitis, lung cancer, congenital disabilities, respiratory failure, asthma, and heart disorders. 13, 14, 15 Environmental concerns must monitor nickel concentration levels in such industrial disposal. To detect harmful substances in water, electrodes made of carbon are frequently utilized. Numerous characteristics of carbon-based electrodes, including carbon fiber, graphene, activated carbon, and carbon nanotubes, make them ideal for this use.16, 17, 18, 19, 20, 21 22 Due to their high conductivity, harmful substances can be quickly detected and efficiently transferred. They also have a lot of surface area, which enhances detection sensitivity and selectivity. Carbon-based electrodes are a practical choice because they are inexpensive and simple to make. Additionally, they have strong chemical stability, which lessens corrosion. 23, 24 Electrodes made of carbon can be employed in several detection techniques, including electrochemical impedance spectroscopy, voltammetry, and amperometry. 25, 26, 27, 28 These techniques are accurate and focused; electrodes made of carbon are frequently employed to find harmful substances in water. However, prompt gamma-ray analysis is recognized as a suitable technique for detecting toxic elements in water samples.
The nuclear process, known as the neutron capture (n, γ) reaction, is utilized in the rapid gamma-ray activation analysis method. The binding energy of the captured neutron is transferred to the excited state of the target nucleus. The excited compound nucleus rapidly undergoes de-excitation, typically within a timescale of less than 10-14 seconds, by emitting characteristic prompt gamma rays. A radioactive nucleus can arise as a result of this de-excitation, and it can eventually de-excite or decay by generating various delayed gamma rays.29 During neutron irradiation, the target material emits gamma rays, and these rays may be detected using PGNAA. However, the overdue gamma rays released by the descendant nucleus radioactive responses are used in neutron activation studies. To produce beta particles, delayed gamma rays, and prompt gamma rays, as shown in Figure 1, a neutron must be captured by the target nucleus.
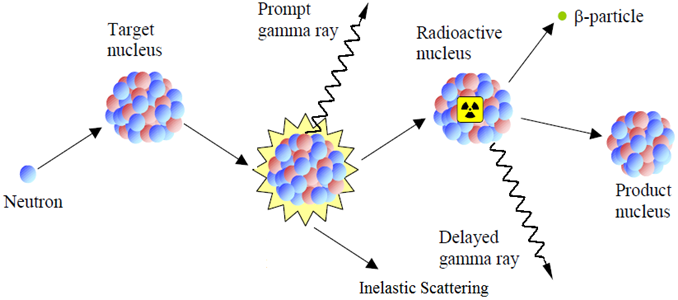
Figure 1: The illustrated process involves the capture of a neutron by the target nucleus, resulting in the subsequent emission of beta particles, delayed gamma rays, and prompt gamma rays.
Comprehending the distinction between PGNAA and its stringently associated counterpart, neutron activation analysis, is crucial. As depicted in Figure 1, neutron activation analysis analyzes the delayed gamma rays, whereas PGNAA examines the prompt gamma rays.30 Before any radioactive decay, PGNAA uses the quick gamma rays released by the excited metastable product.29 Such mechanism allows the ultimate nucleus to release the acquired energy for excitation, typically within a time frame of approximately 10-15 seconds. Consequently, in situations where rapid outcomes are prioritized, PGNAA proves to be a favorable method. In the PGNAA setup, neutrons are generated using nuclear fusion involving two deuterium atoms, as expressed by equation (1):
1 D + D → H e 3 E n + n = 2 . 5 M e V
Through deuteron acceleration towards an energy level of a few hundred keV and colliding it with a target of deuterium, the deuterium atoms (D + D) fusion occurs, leading to the feedback described above. The neutron created during this fusion reaction has an estimated kinetic energy of 2.5 MeV.31
Nonetheless, at first these neutrons are rapid and have a small capture cross section. To transform them into slow-moving thermal neutrons, a polyethylene moderator is employed. This moderator, which contains a high atomic hydrogen density, effectively slows down the neutrons. Since hydrogen has a mass similar to that of neutrons, the conservation of linear momentum guarantees the extreme energy loss and deceleration of the generated neutrons, resulting in a maximum rate of thermally induced neutrons. Energy loss from the moving mass in a collision with a stationary mass, as indicated by the energy loss equation (2), is greatest when the two masses are identical, according to the fundamental theory of collisions.
2 E R | m a x E n = 4 A ( 1 + A ) 2
In the given equation, ER|max, A, En, represents the extreme conceivable energy loss due to the flinching of the nucleus moderator, nucleus moderator mass, and the induced neutron energy, respectively. To enlarge the ratio E R | m a x E n , that corresponds to minimizing the energy (and speed) of the emergent neutron to produce thermal neutrons; calculus shows that the condition for d d A E R | m a x E n = 0 is satisfied when A = 1. Therefore, hydrogen, with a mass number of 1, is an excellent neutron moderator since it has the lowest mass number.
One of the greatest difficulties in the detection of gamma rays is the identification of weak gamma ray emissions.32 Count rates in these situations are often very low, calling for a highly sensitive detector. In comparison to further detectors such as BGO, LaBr3:Ce, NaI(Tl), and HPGe, the CeBr3 detector offers numerous advantages, including user-friendliness and high energy resolution. According to F. Quarati et al.33 , CeBr3 represents an optimal compromise for detecting low-intensity gamma rays. This advantage stems from the fact that both bromide and cerium are not unsurprisingly radioactive, making their applications well-suited to low and high-energy gamma rays. Therefore, a large cylindrical CeBr3 detector measuring 76 mm (height) by 76 mm (diameter) was used for this investigation. Using a PGNAA detector based on a portable neutron generator, nickel concentrations in polluted water samples were determined.34 Nickel in water samples may now be detected since the minimum detectable concentration (MDC) has been established.
Figure 2 depicts the experimental arrangements employed for PGNAA, comprising a CeBr3 detector, a polyethylene cylindrical moderator with high density, and an MP320 neutron generator (portable). The PGNAA system utilizing such a portable neutron generator includes a cylindrical moderator made of polyethylene ( C 2 H 4 ) n with high density. This mediator encompasses an essential cylindrical cavity capable of accommodating a sample having a 9 cm and 14 cm diameter and length, respectively. A cylindrical CeBr3 gamma rays detector thru dimensions of 76 mm (height) and 76 mm (diameter) aligns its horizontal axis with the moderator and the main axis of the sample when it is positioned at a right angle to the axis of the neutron generator. Around the gamma-ray detector, a shielding system consisting of lead and paraffin materials has been installed to prevent the undesired passage of gamma rays and neutrons to the detector. The neutron generator portable MP320 operates by producing rivulet neutrons of an energy of 2.5 MeV through fusion of deuterium ions (D + D) reactions. The corresponding D(d, n) reactions use a deuteron beam of 70 A with a 70 keV energy to produce a pulsed neutrons beam of 2.5 MeV. These profligate neutrons with trivial neutron capture cross-sections are subsequently moderated by a polyethylene moderator (characterized by a high density of atomic hydrogen) to produce thermally generated neutrons, which possess a large cross section for neutron capture. To facilitate PGNAA testing of cylindrical samples, a cylindrical cavity with a radius of 100 mm has been drilled through the moderator. The detector is protected from neutrons and stray gamma rays by a lead shield 3 mm thick and a paraffin shield 50 mm wide. Scionix Holland BV provided the CeBr3 gamma-ray spectrometer with high sensitivity employed in this experiment.

Figure 2: A simplified diagram of the PGNAA system that uses the MP320 portable neutron generator.
The samples consisted of three nickel-contaminated water samples with varying concentrations of nickel as 2.7 wt.%, 5.0 wt.%, and 6.5 wt.%. These water samples were specifically chosen for analysis to evaluate the PGNAA technique's performance in detecting and quantifying nickel contamination.
Table 1: A list of the nickel analytical samples using Ni(NO3)2 solution in water at different concentrations.
|
Sample Number |
Nickel Concentration (wt.%) |
Molarity (mole) |
Chemical Solution |
|
1 |
2.7 |
0.5 |
Ni(NO3)2 |
|
2 |
5.0 |
1.0 |
Ni(NO3)2 |
|
3 |
6.5 |
1.4 |
Ni(NO3)2 |
In order to ensure personnel safety, strict measures were taken before initiating the experiment. Before activating the neutron beam, the primary experimental room containing the neutron generator was properly secured with a lock. During the investigation, a bias voltage of +700 V was delivered to the detector. The detector was hooked up to a pre-amplifier to reduce the amount of noise produced by the experiment and transform gamma rays into electrical signals. After that, these signals were guided to an amplifier circuit that was placed in the controller chamber. Output in the form of intensity plotted against channel number was produced by the CeBr3 detector. This output was displayed and stored on a computer. In the experimental design that we used, the distinctive gamma rays produced by the samples after they had been irradiated served as one-of-a-kind identifiers, making it possible to determine which chemical components were present in the sample. To make this procedure easier, several electrical components were linked together and attached to the detector. 35, 36, 37 The detector was linked with a photomultiplier and a pre-amplifier so that it could transform incoming photons into electrical signals and eliminate noise interference at the same time. Additional components included an amplifier to enhance the signal amplitude and an analog-to-digital converter to digitize the input pulse height and assign it to certain channels. Both of these components were added to the system. In addition to this, a linear gate stretcher was added so that signals may be selectively gated for pulses height analysis as essential. The quick gamma rays data that the prepared samples emitted were captured and recorded on a personal computer once they were released. The coarse and fine gains on the amplifier of the electronic setup were modified to 5 and 11, respectively, so that it could accommodate an energy range with a maximum energy peak of 10 MeV. This was done so that the electronic setup could support 512 channels. These adjustments allowed for precise signal amplification and channel allocation within the energy range of interest.
Without a sample in the cavity and with the neutron beam turned off, the CeBr3 detector's intrinsic spectrum may be determined. This enabled the detection of gamma rays generated by radioisotopes that occurred naturally in the detector material. This sprint lasted for around 2998 seconds. The detector spectrum exhibited an intensity profile that followed an exponential decay pattern, with modulations caused by impurity radioisotope peaks. This observation aligned with theoretical predictions, as higher energy ranges typically experience lower levels of random background radiation compared to lower energy ranges. However, the smooth decay profile was intervallic by distinct intrinsic peaks corresponding to the energy decay of numerous expected radioisotopes existing in the detector. According to the literature,[] the presence of cerium (Ce) and bromine (Br) in the detector material contributes to its intrinsic activity. This may be explained by the fact that the raw materials used in the detector production included radioactive impurities composed of actinium-227. The homologous nature of actinium and cerium makes their separation challenging, resulting in actinium contamination with a trace amount in the cerium. The essential spectrum of the CeBr3 detector displayed three projecting peaks at 1479, 1746, and 1995 keV, corresponding to the 227Ac contamination, as described in Figure 3(a).
The channels were calibrated by utilizing known peaks acquired from samples of cobalt-60 and cesium-137, which allowed the intrinsic spectra received from the CeBr3 detector to be converted into energy values. The whole spectrum of Cs-137 is shown in Figure 3(b), focusing on the peak at 661 keV that is distinctive of this element. Similarly, Figure 3(c) provides a comprehensive representation of the spectrum of Co-60, highlighting the element's two distinctive peaks located at 1173 and 1333 keV. These known peaks were used as reference points to establish the energy calibration for the detector channels. In Figure 3(b, c), the Co-60 two characteristic peaks and the Cs-137 one peak were utilized to determine the energy calibration ratio. By establishing a best-fit line, the gradient of this line was found to be 5.2759 keV/channel. This conversion factor was then applied to transform the detector (CeBr3) intrinsic spectrum owing to the channel numbers with suitable energy spectrum. Figure 3(d) depicts the CeBr3 detector intrinsic gamma ray activity spectrum, covering a broad energy range of 0 - 2500 keV. The spectrum was acquired using higher gain settings on the amplifier (fine gain of 8 and coarse gain of 20) to ensure the recording of the entire spectrum, with particular attention to the peaks of attention situated in the low energy section. These peaks correspond to 1479, 1746, and 1995 keV energies, as illustrated in Figure 3(e).
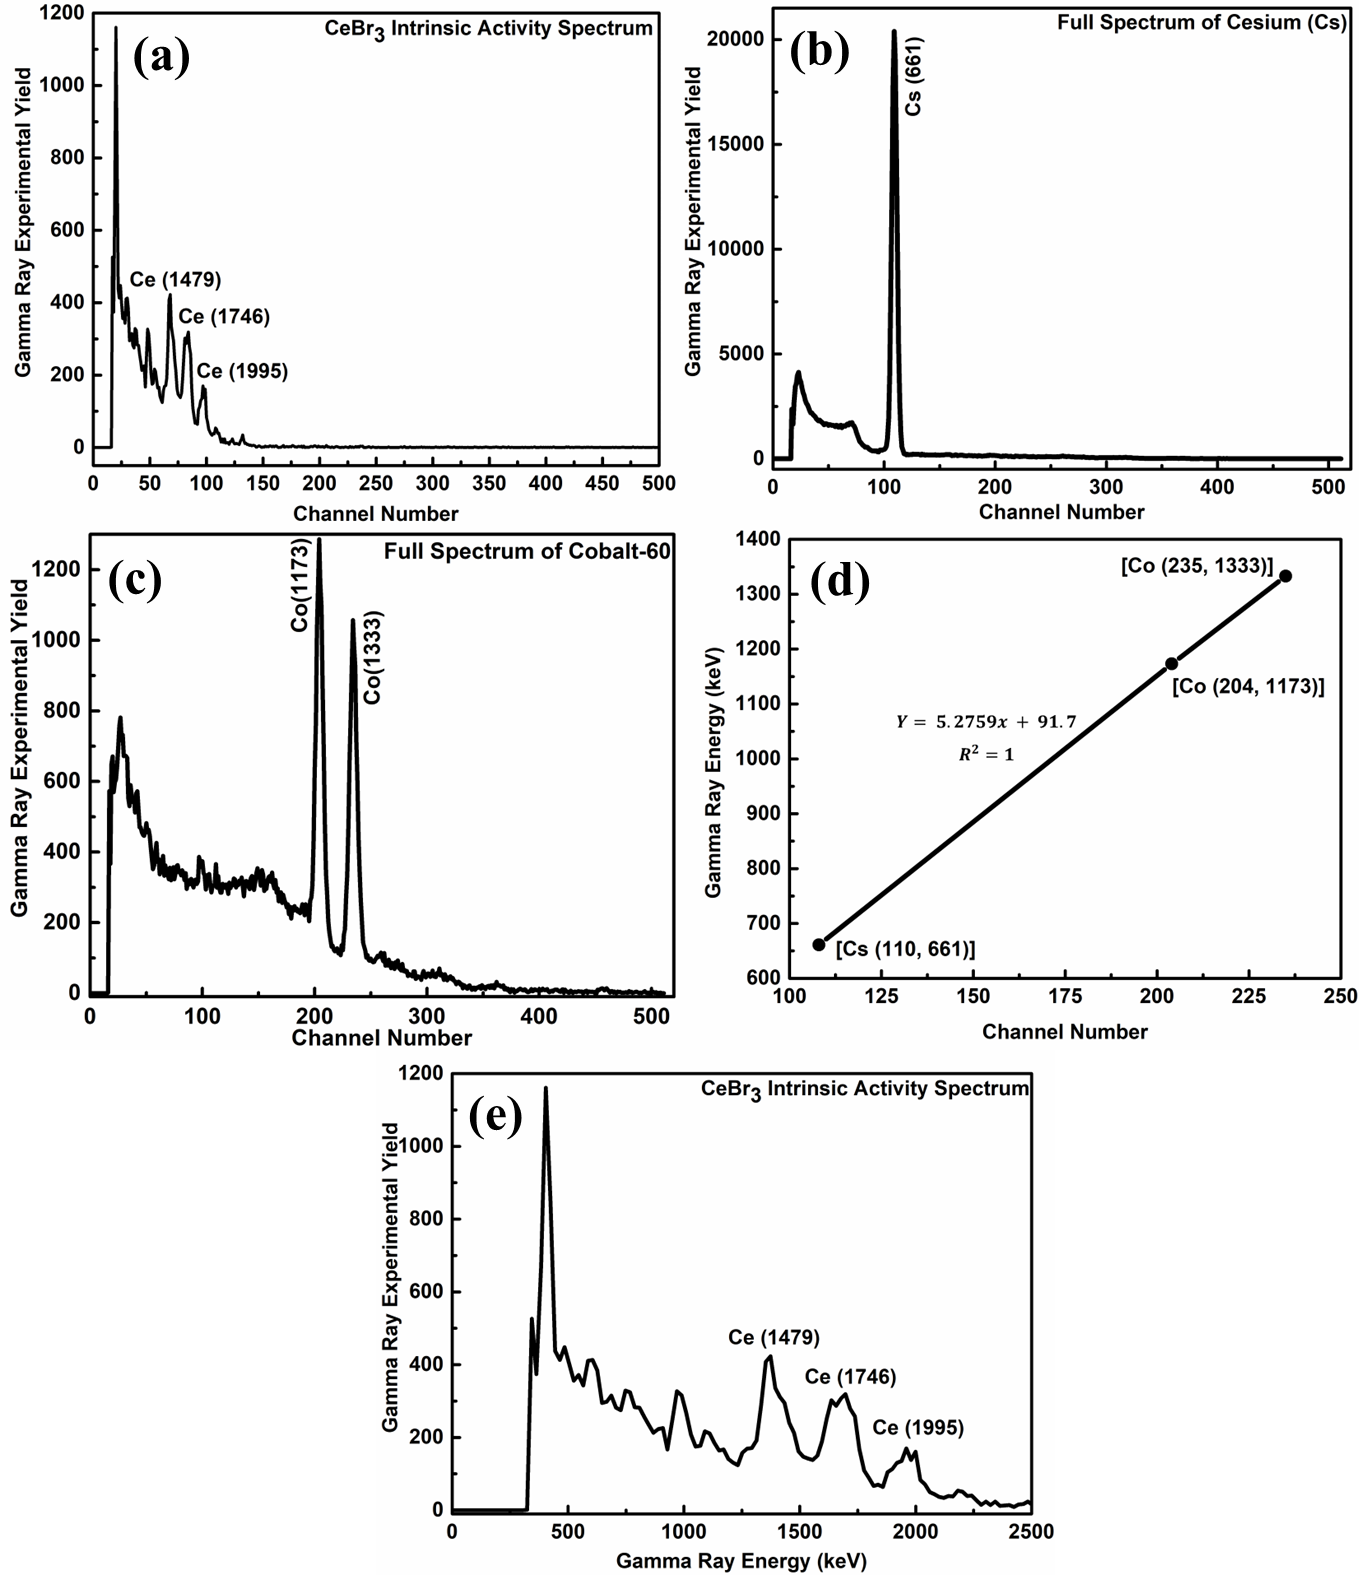
Figure 3: (a) A unique spectrum of the intrinsic activity of the CeBr3 detector. (b) Cs-137 and (c) Co-60 spectra in their entirety for calibrating a CeBr3 detector. (d) CeBr3 detector energy calibration curve with Cs-137 and Co-60 standards. (e) Intrinsic activity spectrum for the intrinsic detector (CeBr3).
While the previous measurements and discussion focused on the calibration of minimum energy for the CeBr3 detector, equal attention was given to the high-energy calibration. This was necessary because the prominent peaks of our nickel sample were located in the high-energy range, specifically between 8900 and 9500 keV. Consequently, the calibration procedure was required for establishing the correlation between gamma rays energy and channel number within this extreme range. Unfortunately, no standard samples were available that spanned the high-energy range necessary. As a result, an alternative calibration approach was employed by utilizing the peak of gamma ray with a recognizable element present in the mediator, namely H2. The detection of H2 was attributed to its presence in the polyethylene (C2H2)n moderator material.
The energy of gamma rays emitted by hydrogen is well-established at 2223 keV.38 To perform the high-energy calibration of the detector, the measurement was conducted using a low coarse gain and fine gain of 5 and 11 on the amplifier, respectively. This adjustment was made to shift the marker peak of hydrogen to a lower energy region while expanding the high-energy range of interest. The initial data analysis revealed that the hydrogen peak appeared by the channel number 110, as depicted by Figure 4. Subsequently, the relationship between channel number and gamma-ray energy was derived, as described in equation (3).
3 E n e r g y p e r c h a n n e l = 2223 k e V 110
The calibration process resulted in determining a conversion factor of 1 channel = 20.2 keV. The entire spectrum was transformed from channel number to energy using this conversion factor. The spectrum now displays the complete range of channel numbers, including the prominent marker peak of hydrogen at 2223 keV, corresponding to channel number 110. Figure 7 provides a visual representation of the converted spectrum.
The moderator cavity was filled with the water bottle, and the neutron beam was turned on to obtain the spectrum of the water samples contaminated with nickel. Because of this, the peaks typical of nickel ended up being overlaid on the background spectrum, which led to the creation of the net sample spectrum. It is of the utmost importance that the investigational runs times of the activation spectrum for the employed detector and the entire sample spectrum agree. For instance, if the former had a run time of 2998 seconds, the latter should also have a similar duration. Otherwise, running the background for a significantly longer or shorter period than the samples would lead to a higher or lower background level compared to the net nickel spectra, resulting in a suppression rather than the appearance of peaks. Figure 4 illustrates the 6.5 wt.% nickel spectrum overlaid on the background spectrum. The effect of the nickel sample can be seen in the region of interest, with two strong peaks found at 8993 and 9498 keV, which correlate to the moderator peak at 2223 keV. Figure 4 displays the gamma-ray spectra of various elements, including those originating from the sample, detector, and moderator. These additional peaks, arising from sources other than the sample, are categorized as background peaks. Following this, swift gamma rays spectra were noted for the contaminated three water samples nickel impurities having concentrations of 6.5, 5.0, and 2.7 wt.%, respectively.
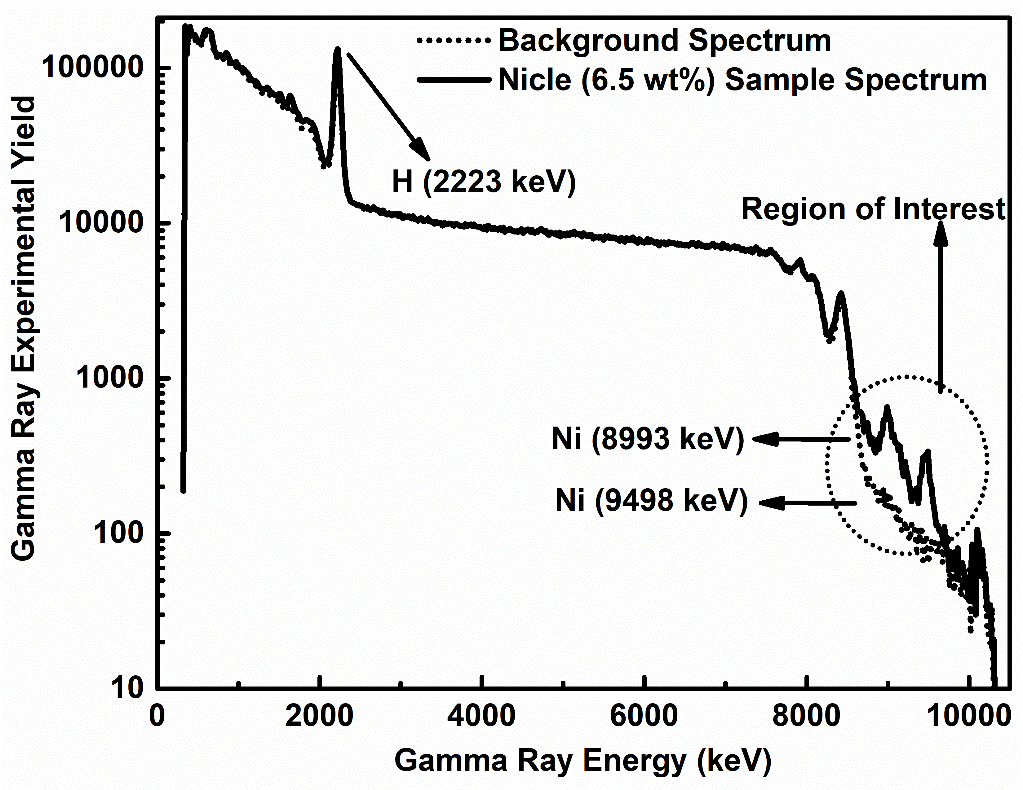
Figure 4: The spectrum of nickel (solid) superimposed over the spectrum of the background (dotted).
Figure 5(a) illustrates the normalized spectra obtained from each water sample containing varying concentrations of nickel. A comparison of these spectra reveals that all three nickel samples exhibit two distinct peaks at 9498 keV and 8993 keV. In contrast, the background spectrum does not deviate from its plane anywhere inside the area of interest, which indicates that it does not contribute to the peaks that are required. To assess the performance of the detector and eliminate the background effect, difference spectra were examined. The transformation spectra were obtained by deducting the background spectrum from the spectrum of examined samples. These spectra with the deducted background for the three nickel samples, with concentrations of 6.5, 5.0, and 2.7 wt.%, remained overlaid onto one another within the interested energy range of gamma rays from 8600 to 9600 keV. The noticeable spectral differences amongst the nickel samples are seen in Figure 5(b).
It is anticipated that the integrated yield, which was calculated by calculating the area under the three different spectra, would be inversely proportional to the nickel content in the water samples. The cohesive yield was plotted in contradiction to the nickel concentration to investigate this relationship, as shown in Figure 5(c). The resulting plot indicates whether the detector exhibits a linear response. The least-squares regression line was fitted to the data, resulting in a correlation coefficient of R2 = 0.9979 with a regression equation of y = 204x + 915, as depicted in Figure 5(c).
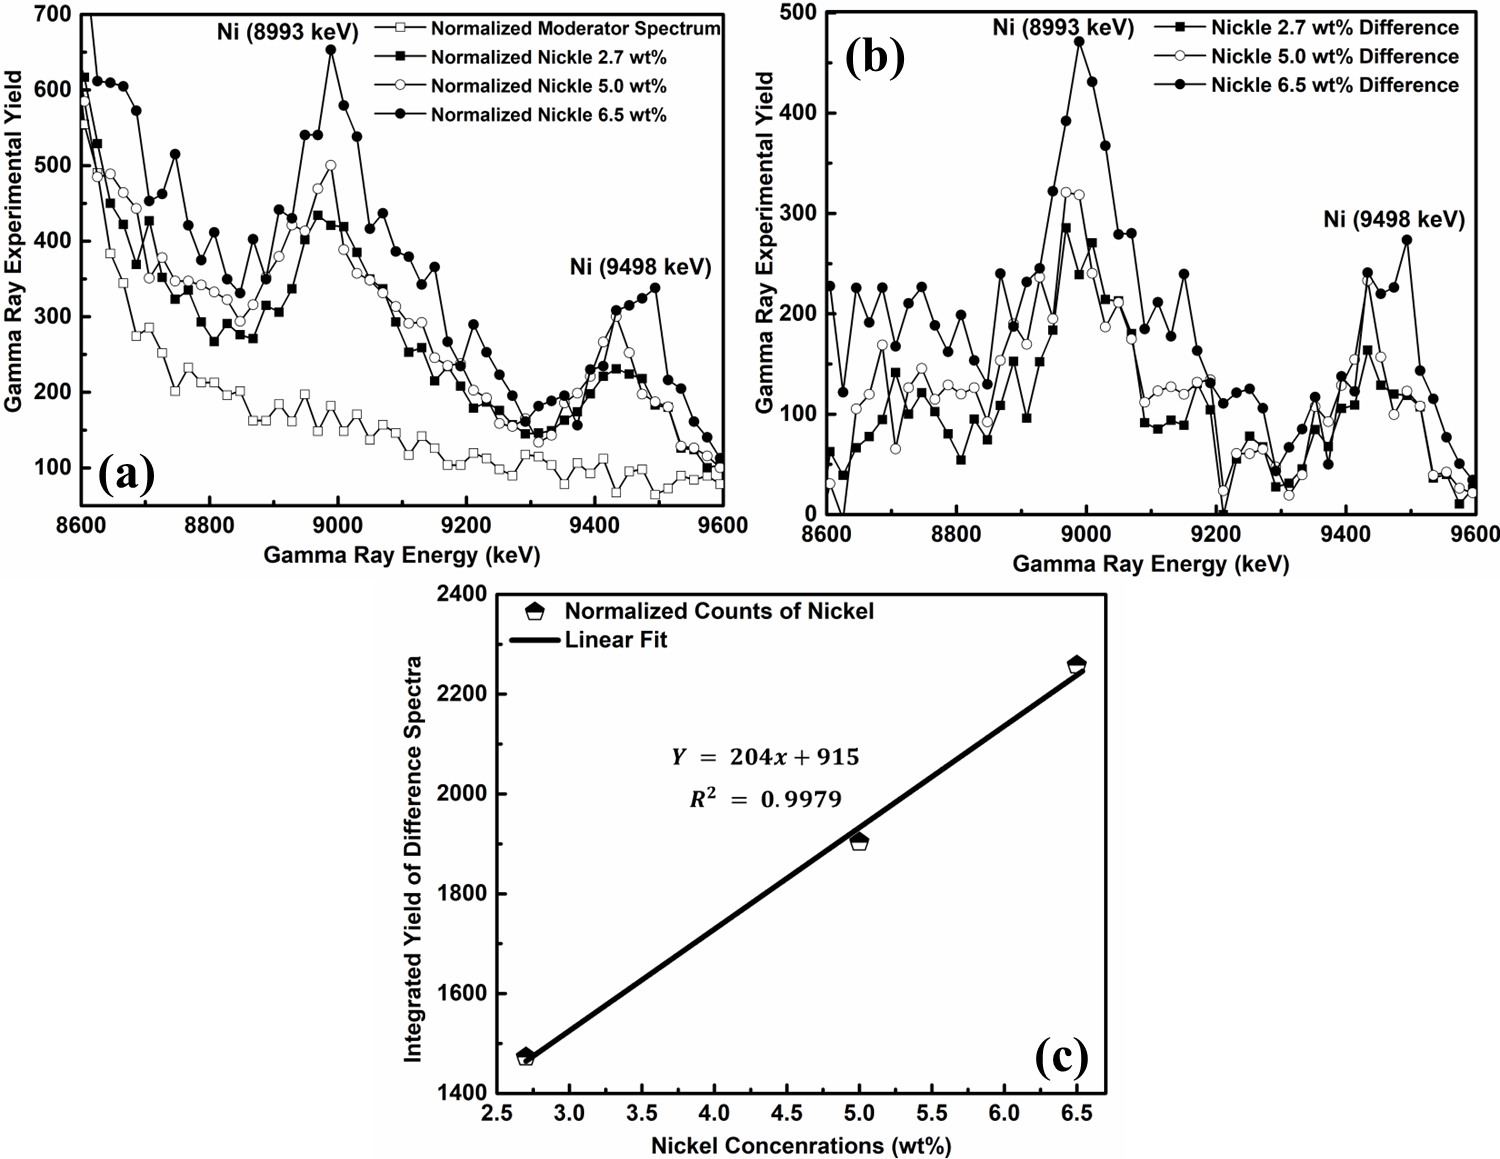
Figure 5: (a) The three water samples contaminated with nickel of various concentrations of 6.5, 5.0, and 2.7 weight percent have their spectra normalized. (b) Spectra variations for three water samples contaminated with nickel of various concentrations. (c) Gamma-ray intensity calibration curve vs. nickel concentrations (wt.%).
A closer look at Figure 5(c) reveals that the three data points have a good amount of dispersion around the regression line that best fits the data. When the complete statistic is scrutinized, this is readily apparent. This indicates that the data is primarily affected by inherent arbitrary errors that cannot be ignored. Furthermore, the strong positive association between the two datasets is shown by the high correlation value of 0.9979. The experimental findings support the anticipated proportionality relationship and show that the CeBr3 detector operates consistently. The CeBr3 detector was used to calculate the nickel MDC in water samples using the PGNAA system. The calculation of MDC could be computed utilizing the equation (4).39
4 M D C = 4 . 653 × ( C / P ) × B
The MDC was calculated using equation (4), where C signifies the wt.% concentrations, P indicates the overall counts encountered by the peaks, and B shows the allied background counts underneath the peaks. Equation (5) was used to find the inaccuracy in MDC.
5 σ M D C = C P × [ ( 2 × B ) ]
The nickel in the samples released gamma rays with energies of 8993 keV and 9498 keV, and the MDC was independently computed for each. Additionally, the MDC was combined for both since both peaks come from the identical isotopes. The concluding MDC of nickel concentration in water samples was determined to be 0.0815±0.0250 wt.%, corresponding to 815±250 ppm. Tabl40 e 2 tabulated the detailed MDC values recorded in these experiments.
Table 2: MDC values of nickel in the prepared toxic water samples.
|
Peak No. |
B |
wt.% |
P |
MDC (wt.%) |
mole |
MDC (PPM) |
|
8993 keV |
123 |
2.7 |
1473 |
0.0946 |
0.5 |
945.91 |
|
115 |
5.0 |
1513 |
0.1636 |
1 |
1635.78 |
|
|
94 |
6.5 |
1012 |
0.2915 |
1.4 |
2915.37 |
|
|
9498 keV |
78 |
2.7 |
713 |
0.1556 |
0.5 |
1556.16 |
|
53 |
5.0 |
558 |
0.3011 |
1 |
3011.05 |
|
|
49 |
6.5 |
452 |
0.4713 |
1.4 |
4712.71 |
|
|
8993 keV+9498 keV (Combined) |
201 |
2.7 |
2186 |
0.0815 |
0.5 |
814.79 |
|
168 |
5.0 |
2071 |
0.1445 |
1 |
1444.41 |
|
|
143 |
6.5 |
1464 |
0.2486 |
1.4 |
2485.64 |
In this study, the PGNAA technique was utilized to establish the relationship between the concentration of nickel in water solutions and the gamma rays detected by the CeBr3 detector. Water samples with nickel concentrations of 2.7, 5.0, and 6.5 wt.% were analyzed. The results revealed that higher nickel concentrations corresponded to a greater number of detected gamma rays. Using the principle that the integrated prompt gamma yields is related to the sample concentrations; we compared the experimental findings from using the CeBr3 detector to the theoretical postulate. Linear regression curve fitting of the test data demonstrated that the CeBr3 detector is consistent with the aforementioned theory. The measured MDC for nickel was determined as 0.0815 ± 0.0250 wt.%, equivalent to 815 ± 250 ppm. Furthermore, the technique employed in this study can be extended to detect the limits of other detectors and perform elemental characterization of unknown samples. This versatility is valuable for environmental pollutant analysis and identifying illegal substances, showcasing the potential benefits of this technique for societal advancements.
The author would like to express their gratitude to the Department of Physics at King Fahd University of Petroleum & Minerals, Dhahran, Saudi Arabia, for granting access to the necessary instrumental support throughout this study. Special thanks are given to Prof. Akhtar Abbas Naqvi, former Professor in the Department of Physics at King Fahd University of Petroleum & Minerals, for his invaluable supervision and guidance.
Keywords: Water toxicity,Detection Limit,Nickel
Materials Innovations (MI) is an interdisciplinary journal devoted to significant experimental and theoretical findings on the synthesis, structure, charachterization, processing and applications of materials. Materials Innovations is dedicated to publishing peer reviewed novel, cutting edge reports of broad interest to the materials science community.